
Performance tuning, everybody loves that. Maybe you got your car remapped for more power. Maybe you overclocked your CPU for some more GHz. Maybe you want to shave a few milliseconds off your PowerShell execution time but don’t know where to start. Today on The Dot Source, we’ll discuss benchmarking your current code, then looking at some code constructs that will bring those execution times down. Time to take that base model Honda and put $100,000 under the hood.
In small scale scenarios, some of these methods will only be saving milliseconds. However, when you work in large environments and the script has to process tens of thousands or potentially hundreds of thousands of objects, small optimisations can make a huge difference. The architecture of the code will be the primary factor in how it performs, but that’s too big a topic for this article. What is discussed here are some comparisons on particular syntax available throughout the evolution of PowerShell, and just as importantly, how to measure code execution time and identify areas for improvement.
Measuring Code Execution Time
Understanding how long code takes to execute is an important first step to improving it. Let’s take a look at 2 methods, one for overall execution time, and another more granular approach.
First, the Measure-Command. This is a simple built in CMDlet that you can use to measure the execution time of a CMDlet or script block. For example, how long does Get-Service take to execute?
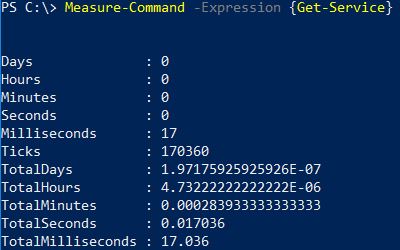
We can use this for more complex script blocks or functions. While this is a quick and useful tool, the drawback is that we don’t know how the execution time is distributed across our code, and therefor it becomes difficult to identify bottlenecks or potential areas for improvement.
The second tool is an interesting module called PowerShell Chronometer by Kevin Marquette. PowerShell Chronometer will allow you to analyse how long each line takes to execute, and how many times each line was executed. This is a fantastic granular approach really helps you identify code bottlenecks.
The PowerShell Chronometer module can be found here:
https://github.com/KevinMarquette/Chronometer
To demonstrate the capabilities of PowerShell Chronometer, we’ll use the following sample code “Invoke-PerfTestLow”. As the name might suggest, this is a low performance piece of code that is not particularly optimised.
function Invoke-PerfTestLow {
    <#
    .SYNOPSIS
        Sample script with sample constructs to demonstrate performance differences.
    .DESCRIPTION
        Demonstrates the difference between differing Powershell constructs and their performance difference.
    .EXAMPLE

    .NOTES
        01       12/12/18     Initial version.                    A McNair
    #>

    [CmdletBinding()]
    Param
    (
        [Parameter(Mandatory=$true,ValueFromPipeline=$false)]
        [int]$Iterations

    )


    Write-Host ("## Starting script in low performance mode with " + $Iterations + " iterations.") -ForegroundColor Green

    ## Create a native PowerShell array
    $SampleArray = @()


    ## Start iterations
    for ($i = 1; $i -le $Iterations; $i++) {


        ## Create some dummy properties for the object we will place in the array.
        $HostName = ("Host-" + $i)
        $VMName = ("VM" + $i)

        ## Set different types every iteration for variety
        if ($IsEven) {

            $Type = "Host"
            $IsEven = $false
        } # if
        else {

            $Type = "VM"
            $IsEven = $true
        } # else

        ## Use native PowerShell array type
        $SampleArray += New-Object -TypeName PSObject -Property @{"Host" = $HostName; "VMName" = $VMName; "Type" = $Type;}

        ## Filter these objects and return only those of type "VM"
        $VMs = $SampleArray | Where {$_.type -eq "VM"}

    } # for


} # function
This code is saved in a file called Invoke-PerfTestLow.ps1. This code is not doing anything interesting other than creating a bit of work by hitting some commonly used PowerShell constructs that we’ll take a look at later. It takes iterations as a parameter so it can be run a specified number of times. For now, to invoke PowerShell Chronometer against this code we do the following:
$LowPerf = Get-Chronometer -Path C:\TheDotSource\01-Invoke-PerfTestLow.ps1 -ScriptBlock {
    . C:\TheDotSource\01-Invoke-PerfTestLow.ps1
    Invoke-PerfTestLow -Iterations 100
}
$LowPerf | Format-Chronometer
This passes 100 as the value of iterations the function should use. The resulting output is this:

Brilliant, now I can see what exactly is burning time inside this script. In particular, the WHERE filter stands out, with some time spent on the array additions. If only there was a way to speed these up. Oh wait……
Arrays
First up, arrays. The conventional PowerShell approach to defining an array is as follows:
$SampleArray = @()
…..and then to add items to this array, we might do this using the += operator:
$SampleArray += [pscustomobject]@{"Element01" = "Value01"; "Element02" = "Value02";}
To get a handle on what sort of performance penalty is being incurred here, we can use the Measure-Command and a loop construct to isolate and run this line of code at scale, simulating how it might get used in a larger environment.
$ScriptBlock = {

    ## Conventional PowerShell array
    $SampleArray = @()

    ## Get service object
    $Service = Get-Service -Name "WinRM"

    $x = 30000

    for ($i = 0; $i -le $x; $i++) {

        $SampleArray += $Service

    } # for

} # ScriptBlock


Measure-Command -Expression $ScriptBlock
On my laptop after taking the average of 3 runs this takes an enormous 19,968 ms.
As an alternative, PowerShell allows us to use .net arrays. The syntax for these is a little more complex than its PowerShell counterpart. Let’s run that in the same loop construct to see what differences there might be:
$ScriptBlock = {

    ## .net defined array
    $SampleArray = [System.Collections.ArrayList]@()

    ## Get service object
    $Service = Get-Service -Name "WinRM"

    $x = 30000

    for ($i = 0; $i -le $x; $i++) {

        $result = $SampleArray.Add($Service)

    } # for

} # ScriptBlock


Measure-Command -Expression $ScriptBlock
An average of 3 runs results in 127 ms, a huge improvement over the PowerShell alternative. The fundamental difference here is that PowerShell arrays are destroyed and recreated every time an addition takes place, whereas .net arrays natively allow additions. I can’t see much of a downside, the only thing going for the PowerShell array is that it’s a little easier with it’s syntax.
Filtering Object Collections
Let’s consider the scenario where you have issued a Get-Something CMDlet which has returned a large collection of objects, perhaps virtual machines. Very likely you will then want to filter on this collection to get to a particular object or objects. Your choice of syntax here has a significant effect on how long this takes, and looking at PowerShell evolution over the years there are now a few choices.
To give us something to simulate against I’m going to create a dummy collection of objects to filter on by running this one liner:
for ($i = 0; $i -le 500; $i++) {$testObj += Get-Process}
On my system this results in a collection of around 97,000 objects. We can compare different filtering methods by scaling up the code inside a loop and measuring how long these loops take to complete.
Let’s take a look at the first example using the Where-Object CMDlet as found in PowerShell 1.0:
$ScriptBlock = {

    $x = 20

    for ($i = 0; $i -le $x; $i++) {

        $results = $testObj | Where-Object { $_.Name -eq 'powershell_ise' }

    } # for

} # ScriptBlock


Measure-Command -Expression $ScriptBlock
Over an average of 3 runs this took 31,911ms.
Since PowerShell 3 we have the simplified “Where” syntax, but when testing, this was much the same as Where-Object. Maybe we can do better with the .Where method as found in PowerShell 4. Let’s see what happens:
$ScriptBlock = {

    $x = 20

    for ($i = 0; $i -le $x; $i++) {

       $testObj.Where({ $_.Name -eq 'powershell_ise' })
    } # for

} # ScriptBlock


Measure-Command -Expression $ScriptBlock
Our 3 run average is down to 11,023 ms, so a massive improvement. But wait, there’s more. Let’s try a custom filter:
filter isISE {
    if ($_.Name -eq 'powershell_ise') {
        $_
    }
}


$ScriptBlock = {

    $x = 20

    for ($i = 0; $i -le $x; $i++) {

        $testObj | isISE

    } # for

} # ScriptBlock

Measure-Command -Expression $ScriptBlock
Our 3 run average comes back at 2,385 ms, very impressive. Take a scenario where maybe you are filtering large collections thousands of times in a loop, this could save a huge amount of time.
Casting Objects
If like me you create objects to store data to report back to another workflow, then you will likely be creating PowerShell custom objects. There are 2 different ways of accomplishing this that we’ll compare, the New-Object CMDlet and the [pscustomobject] type accelerator. Let’s bash each of them through our loop construct to see which is fastest:
$ScriptBlock = {

    $x = 50000

    for ($i = 0; $i -le $x; $i++) {

        $result = New-Object -TypeName PSCustomObject -Property @{"prop1" = "test";}

    } # for

} # ScriptBlock


Measure-Command -Expression $ScriptBlock
An average of 3 runs takes 3,465 ms. Doesn’t seem bad for 50,000 objects, but can we do better with a type accelerator?
$ScriptBlock = {

    $x = 50000

    for ($i = 0; $i -le $x; $i++) {

        $result = [pscustomobject]@{"prop1" = "test";}

    } # for

} # ScriptBlock


Measure-Command -Expression $ScriptBlock
We certainly can, this method averages out at 578 ms, a huge improvement.
Demonstration: High versus Low Performance Script
Let’s pull these techniques together into one script. We have already seen the “Low Perf” script in action for the Chronometer demo. Let’s modify this with the techniques discussed so far to create a “High Perf” script:
function Invoke-PerfTestHigh {
    <#
    .SYNOPSIS
        Sample script with sample constructs to demonstrate performance differences.
    .DESCRIPTION
        Demonstrates the difference between differing Powershell constructs and their performance difference.
    .EXAMPLE

    .NOTES
        01       12/12/18     Initial version.                    A McNair
    #>

    [CmdletBinding()]
    Param
    (
        [Parameter(Mandatory=$true,ValueFromPipeline=$false)]
        [int]$Iterations

    )


    ## Clear the screen
    cls
    Write-Host ("## Starting script in high performance mode with " + $Iterations + " iterations.") -ForegroundColor Green


    ## Create a .net array
    $SampleArray = [System.Collections.ArrayList]@()


    ## Define custom filter for VMs
    filter typeVM {
        if ($_.Name -eq 'powershell_ise') {
            $_
        } # if
    } # filter

    ## Start iterations
    for ($i = 1; $i -le $Iterations; $i++) {


        ## Create some dummy properties for the object we will place in the array.
        $HostName = ("Host-" + $i)
        $VMName = ("VM" + $i)


        ## Set different types every iteration for variety
        if ($IsEven) {

            $Type = "Host"
            $IsEven = $false
        } # if
        else {

            $Type = "VM"
            $IsEven = $true
        } # else


        ## Use .net construct
        $null = $SampleArray.Add(([pscustomobject]@{"Element01" = "Value01"; "Element02" = "Value02"; "Element03" = "Value03";}))

        ## Filter these objects and return only those of type "VM"
        $VMs = $SampleArray | typeVM

    } # for


} # function
Using the Measure-Command over a 1,000 iterations the low performance script takes 8,067 ms and the high performance script takes 1,264 ms. PowerShell Chronometer has helped me home in on the particular lines I needed to pay attention to. Considering both scripts are doing the same thing, this is a considerable difference.
API First
If you need to filter or query for particular things, it is usually better to allow the API you are using to do the heavy lifting. This could be a REST API where you are able to supply a property value or a CMDlet that has a native parameter to filter for you. To illustrate the point, let’s take a look at the Get-Service CMDlet. If I were looking for a particular service, I could do 2 possible things. Firstly, get all the services and filter on them (slow). Secondly use the native -Name parameter to specify the service I want (fast). Let’s measure the difference between the 2:
$ScriptBlock = {

    $x = 1000

    for ($i = 0; $i -le $x; $i++) {

        $Service = Get-Service | where {$_.Name -eq "WinRM"}

    } # for

} # ScriptBlock


Measure-Command -Expression $ScriptBlock
Using a typical Where filter resulted in an average of 7,092 ms.
$ScriptBlock = {

    $x = 1000

    for ($i = 0; $i -le $x; $i++) {

        $Service = Get-Service -Name WinRM

    } # for

} # ScriptBlock


Measure-Command -Expression $ScriptBlock
Using the built in -Name parameter results in an average of 697 ms. This proves that it is definitely worthwhile thinking about where you filter the data. Most CMDlets and API’s will be able to do this for you.
Multi Threading
One last thing. All of the samples so far have been single threaded and do one thing at a time. In a real world scenario, this may be a significant hindrance. For example, I need to gather some data or perform some action on thousands of virtual machines managed by multiple vCenters. Conventionally I might connect to each vCenter in turn, do what I want to do, disconnect and repeat. A faster method might be to connect to multiple vCenters and have my actions running in parallel.
Let’s take a look at a single threaded example using the “High Perf” script we created earlier:
$ScriptBlock = {

    ## Perf Test 01
    Invoke-PerfTestHigh -Iterations 1000

    ## Perf Test 02
    Invoke-PerfTestHigh -Iterations 1000

    ## Perf Test 03
    Invoke-PerfTestHigh -Iterations 1000

    ## Perf Test 04
    Invoke-PerfTestHigh -Iterations 1000

    ## Perf Test 05
    Invoke-PerfTestHigh -Iterations 1000

    ## Perf Test 06
    Invoke-PerfTestHigh -Iterations 1000
}


Measure-Command -Expression $ScriptBlock
This simply runs the High Perf script one at a time synchronously. The Measure-Command output gives us a total execution time of 8,253 ms. What if instead of running these one at a time we could run, for example, 3 in parallel? We can accomplish this with the Start-Job CMDlet. This will start a script or script block as a background process which runs asynchronously. Here is some sample code that runs the same High Perf function, with a maximum job size of 3:
$ScriptBlock = {

    ## Set number of iterations
    $x = 6

    ## Set maximum number of jobs
    $MaxJobs = 3

    $ScriptBlock = {

        ## . source function
        . C:\TheDotSource\10-Invoke-PerfTestHigh.ps1

        ## Perf Test Script
        Invoke-PerfTestHigh -Iterations 1000

    }

    ## Start all jobs
    for ($i = 1; $i -le $x; $i++) {

        while ((Get-Job -State Running).count -ge $MaxJobs) {

            Start-Sleep -Milliseconds 100
        } # while

        Write-Host ("Starting worker thread.")
        Start-Job -ScriptBlock $ScriptBlock

    } # for

    ## Wait for remaining jobs to finish
    Write-Host ("Waiting for remaining workers to finish.")

    while ((Get-Job -State Running).count -gt 0) {

        Start-Sleep -Milliseconds 100
    } # while

    Write-Host ("All jobs complete.")

}

Measure-Command -Expression $ScriptBlock
The result is I can complete the same work in 6,073 ms which is decent. My lowly laptop only has 2 cores, so as you scale up in core count, you can also scale up jobs for better performance gains.
Start-Job is a whole blog post in of itself, but I’ll leave it at that for now.
Conclusion
This has by no means been comprehensive, but hopefully was able to give you one or two useful ideas. If you have any tips for improving script performance, leave them in the comments below. In the meantime, all of the code samples in this post are available from The Dot Source Github here:

One thought on “PowerShell Performance Tuning”